What is a lab “fishbone” diagram?
The “fishbone” or “skeleton” diagram is a cornerstone tool used by medical professionals for the rapid organization and interpretation of laboratory test results. While its precise origins remain unclear, the diagram’s development can be attributed to the collective ingenuity healthcare workers seeking to streamline clinical workflow.
Prior to the widespread adoption of electronic health records (EHRs), physicians, advanced practitioners, and nurses relied heavily on paper-based laboratory reports. These reports, often extensive, are difficult to carry around on rounds for quick reference.
How do you use a “fishbone” diagram?
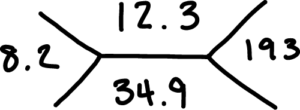
The fishbone diagram emerged as a practical solution. It is a non-standardized visual shorthand system, typically sketched by hand. The core structure resembles a fish skeleton, with branches radiating from a central axis. Each space created between lines represents a specific laboratory value such as hemoglobin, platelets, sodium, etc. Multiple designs are used which are specific to each category of laboratory test, such as electrolytes, complete blood count (CBC), or liver function tests (LFTs).
The fishbone diagram’s versatility lies in its customizability. Healthcare providers can tailor the diagram to their specific needs and areas of practice. For instance, a cardiologist might prioritize a branch dedicated to cardiac biomarkers, while a nephrologist might emphasize a branch for renal function tests.
Why should I use a “fishbone” diagram?
Despite the growing prevalence of readily available lab values on our phones, the fishbone diagram remains a valuable tool for several reasons:
- Rapid Visualization: The diagram’s visual layout allows for quick reference for lab values without opening a patient’s chart.
- Cognitive Recall: The act of constructing and referencing a fishbone diagram can enhance memory and recall of critical laboratory values, particularly for students and trainees.
- Communication and Collaboration: The fishbone diagram serves as a shared language during patient rounds or clinical discussions, promoting clear communication between team members.
Although not a substitute for a comprehensive review of laboratory data, the fishbone diagram offers a practical and adaptable method for healthcare providers to organize and communicate laboratory findings. Its continued use reflects the ongoing need for efficient clinical workflows and effective communication in today’s complex healthcare environment.
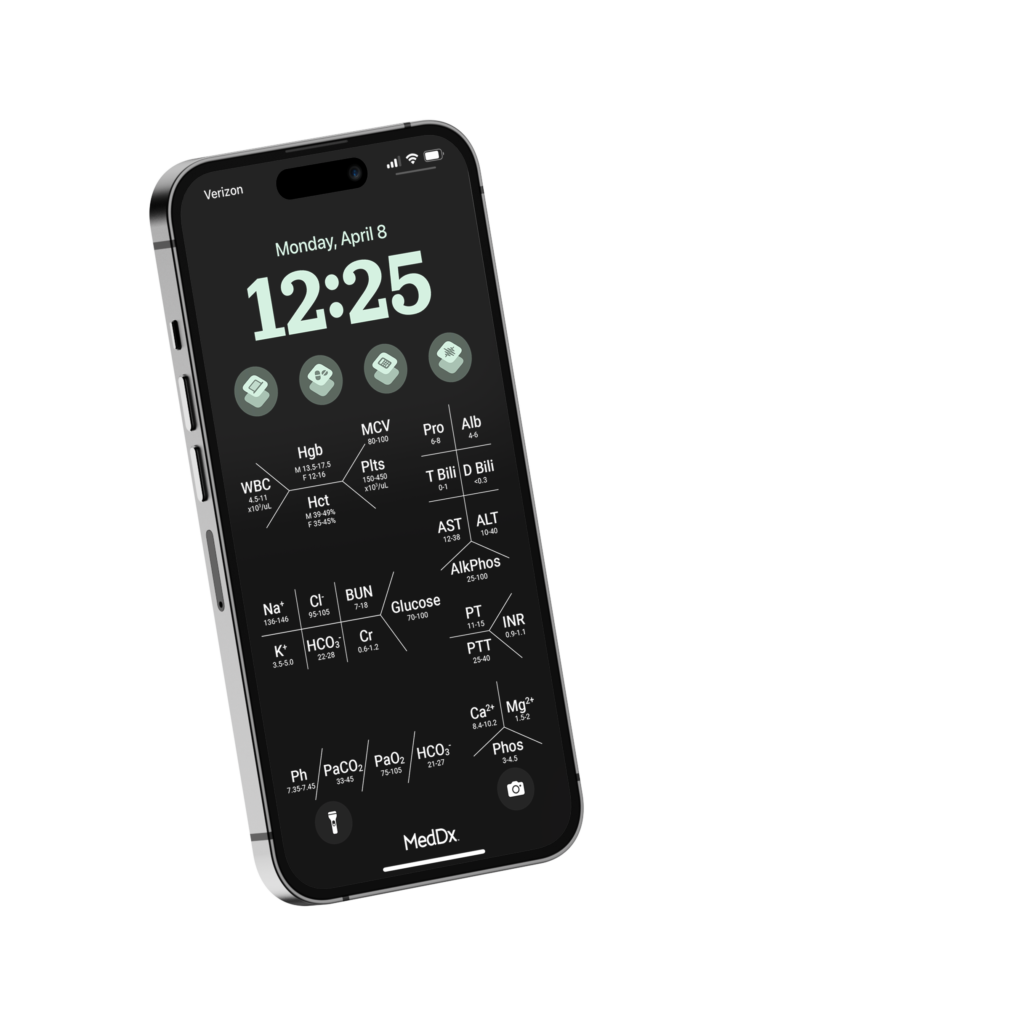
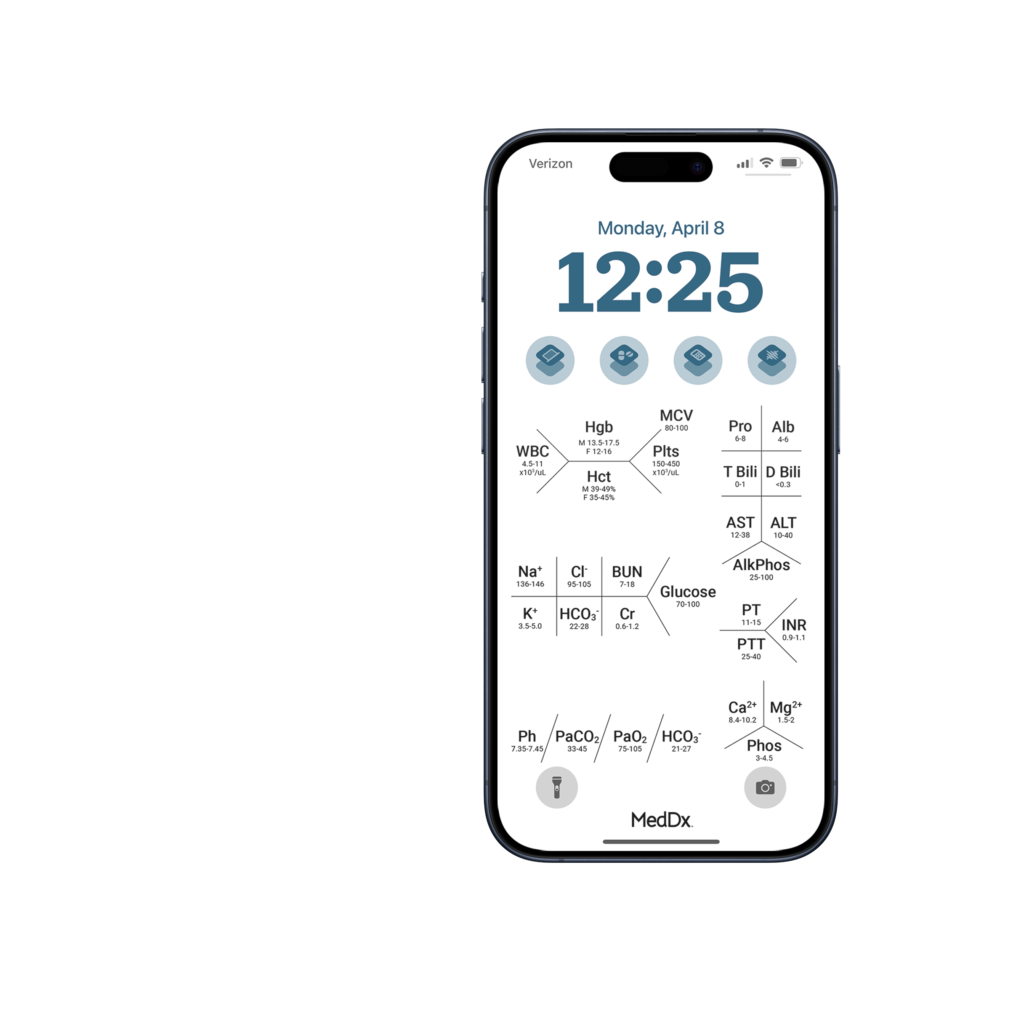
Bonus Tip! Enhance your clinical efficiency by keeping a digital fishbone diagram template on your phone! Download our free, customizable fishbone diagram background for your mobile device.
Free Download
Laboratory values based on the National Board of Medical Examiners (NBME) laboratory reference values sheet.
© 2024 Med Dx Technology, LLC


